MVP Connections, Baseball Edition; or, the lonesome tale of Jake Daubert

Longtime readers of the Edible Ox will probably have seen one of my posts about networks of NBA MVPs. I recently decided to see what would happen if I extended the same idea to baseball, and the answer is that you get a completely insane version of the graph. Here’s the main image (click on it for a much larger version, which will open in a new tab):

2018_MLB_MVP

As always, the principles are simple: Every dot is a player who won an MVP award; they’re connected by a line if they played on the same team in the same year (even if neither of them was an MVP at the time); the colors more or less reflect the players’ main teams; the size of the dots reflects betweenness centrality (basically, how well each guy connects other clusters to each other).

I should note that I was less careful about this one than the NBA one. I know more about basketball, and the network involved much less data, so I tried to make sure players actually played together; I even found a case where Moses Malone played 6 minutes on a no-longer-extant team with Bob McAdoo in 1977. That was just too much to ask here; instead, I just consider guys linked if they played on the same team in the same year—which leaves open the possibility that someone was injured, or even that they were traded for each other. If anyone notices any situations like that (or any mistakes—again, not the sport I follow most closely), I’d definitely be interested to hear about them.

That aside, my favorite thing about the graph is how closely it tells the story of baseball history. The players from roughly a century ago—your Ty Cobbs and Tris Speakers—are way over on the left; you’ve got a few decades of dominant Yankees, from Ruth and Gehrig to Mantle and Maris, nearby; in the middle you’ve got the boys-of-summer Dodgers and the classic Pirates and Giants squads; after a tour through the Big Red Machine and 70’s A’s (not to be confused with the 30’s Philadelphia A’s on the other side of the graph), you’ve got the great 90’s players on the Braves, Astros, and Mariners, and finally a sprawling network of today’s stars. It’s not entirely chronological (Mantle and Mays are far apart), but it does a nice job of creating the kinds of discrete clusters you might see on any given night’s Ken Burns or 30-for-30 episode.

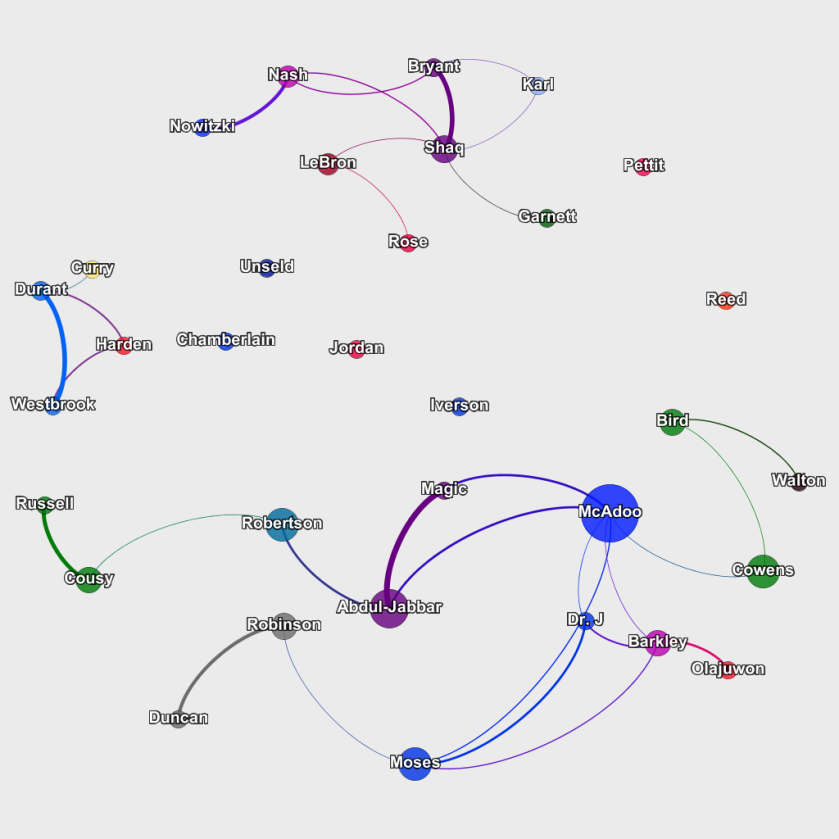
That’s only possible because this graph is way more interconnected than the basketball graph. Here’s that one, for comparison:

2018_NBA_MVP

Here you see 33 players, of whom 6 never played with another MVP. You’ve also got two large clusters of connected players, plus one small one. In baseball, meanwhile, you’ve only got 4 players who are off by themselves, even though there are 153 people represented on the graph. And the 149 other players are all in one cluster. In other words, a baseball MVP is substantially more likely to play on the same team as another MVP at some point in his career, and you can draw a through-line from nearly any guy to any other guy (e.g., Ty Cobb to Mike Trout goes Cobb -> Jimmie Foxx -> Phil Cavarretta -> Nellie Fox -> Joe Morgan -> Rickey Henderson -> Miguel Tejada -> Iván Rodríguez -> Josh Hamilton -> Trout).

There are a few clear reasons for this heightened connectivity. First, and most important, there are twice as many MVPs in baseball every year, since they award both an NL and an AL MVP. Second, there are more players in professional baseball, which leads to more opportunities to play together. Third, baseball players have longer careers. The average career of an MLB MVP is 16.3 years—or 17.1 if you only count retired players (otherwise Mookie Betts is dragging down the average). For basketball players, those numbers are 14.6 and 15.4, respectively. It’s just a season or two difference, but that’s still about a 10% increase in chances to join a new team for baseball players—plus, this may disproportionately affect those weird late-career years when players in both sports start roaming around.

Finally, baseball is just older in general. They’ve had more chances to acquire the kinds of super-long, very connective careers that, say, the WNBA just hasn’t had time to collect yet. Eddie Collins and Rickey Henderson each played for 25 years, Hank Aaron played 23, and none of their careers overlapped. That’s 73 years of totally distinct careers that don’t even capture several important decades; meanwhile the NBA is 72 years old.

Still, I’ll admit that I was surprised at just how completely connected everyone is. When I first made the graph, a few months ago, there were five players who had no connections. Since then, Betts won and connected to Dustin Pedroia, and Andrew McCutchen played not only with Buster Posey but also, after a mid-season trade, with Giancarlo Stanton, who used to play with the other new MVP,  Christian Yelich. Of the remaining loners, three are pretty close to their prime; Kris Bryant got his MVP in 2016, and Bryce Harper and Josh Donaldson got theirs in 2015. It’s entirely possible—based on this network, I’d say it’s probably likely—that they’ll wind up with MVP teammates at some point. And I wouldn’t be surprised if the Betts/Pedroia pair connects to the overall cluster at some point.

And then there’s Jake Daubert. Back in 1911, Hugh Chalmers, some guy who ran a company called Chalmers Automobile, announced that he’d give a free car to the best player in each baseball league. Chalmers died in 1932, the company disappeared in the 1920’s, and the award was discontinued after 1914. But that’s what baseball considers the first MVP award, and Jake Daubert got one in 1913, as the star first baseman of the Brooklyn Superbas (formerly, and later, the Dodgers). I’ll just note that this team also featured a pitcher named Mysterious Walker, whose five year career sent him to five different teams, including the Cleveland Naps and the Brooklyn Tip-Tops of the failed Federal League. You can click on almost any roster in Baseball Reference before 1930 and find a half dozen examples of this kind of nonsense. One more example: Teammates of Daubert in his last season include Bubbles Hargrave, Ivey Wingo, Boob Fowler, Chick Shorten, Greasy Neale, Eppa Rixey, and two different men named Rube. Incredible stuff; our national heritage.

Anyway, the league didn’t start issuing MVP awards again until 1922, so Daubert didn’t have as many opportunities as he might have to collect MVP teammates. And not for lack of trying: He got sick at the end of his 1924 season, and today still holds the unfortunate distinction of being the oldest player to die while still in the majors. This chart gives him another, less gruesome record. Harper, Bryant and Donaldson still have a shot at playing with another recognized great; more than a century after his career ended, Daubert definitely doesn’t. He’s the only MVP in baseball history to have gone it alone.

Does the President usually get re-elected?

Recently I’ve seen a few pundits (mostly on the left) trying to prepare us all for a horrifying future: Trump will probably win in 2020, they say, because Presidents are usually re-elected. I’ve started to wonder: Is that true? Are Presidents usually re-elected?

There are two ways to look at this. First, we can put it in terms of the people who have been President. Here’s a one-paragraph summary of that version of American electoral history:

Washington was beloved, Adams was not, Jefferson was popular, Madison was popular enough, Monroe was very popular, JQA was good but lost, Jackson was bad but won, Van Buren was a schemer who lost, Harrison died, Tyler was an accident, Polk retired, Taylor died, Fillmore, Pierce, and Buchanan were technically President, Lincoln won and the racists murdered him, no one liked Johnson, Grant was beloved, Hayes sort of didn’t even win once, Garfield was murdered, Arthur was meh, Cleveland was chased out, Harrison was chased out, Cleveland got revenge, McKinley won and the anarchists murdered him, Teddy won, Teddy beat Taft without winning, Wilson won, Harding died, Coolidge was technically present, Hoover was loathed, FDR won won won, Truman defeated Dewey, Ike won, JFK was murdered, LBJ won and then gave up, Nixon won and destroyed himself, Ford never won anything, Carter got screwed, Reagan won, Bush barely happened, Clinton won, W won the second time, Obama won, and Trump got in by -3 million votes.

If you do the math, that amounts to 21 Presidents who have been re-elected, vs 22 who haven’t. (You might notice that this doesn’t add up to Trump’s favorite number, 45—that’s because Cleveland was only one actual person, and Trump hasn’t been eligible for re-election yet.) Of the people who weren’t re-elected, 9 lost in the election (like Carter), 5 were more or less primaried and didn’t even get to run (like John Tyler), 3 quit (like Polk), 3 died of natural causes (like FDR), and 2 were murdered (like JFK).

The most straightforward way to interpret this is that, by a small margin, Presidents usually don’t get re-elected, although the reasons are diverse and include a surprising amount of death. Sidenote: 8 out of 44 Presidents have died in office. That’s an 18% mortality rate! These days the most dangerous job in America is logging, and that fatality rate is about 0.1%—so historically, you’re way more likely to die if you become President. Still, healthcare is better than it was in 1850, and it seems like we’re out of that 100-year period where the President kept getting murdered. It might be fair to say that, barring death, re-election is somewhat likely.

At the same time, thinking of this in terms of people gives you some weird results. In some ways, what we really want to know is, sitting here in 2018, how likely is it that Trump gets re-elected? The data above isn’t great for that. Sitting in 1966, you had Lyndon Johnson, who counts as re-elected above, since he won in 1964, after serving one year—but he was eligible in 1968 and didn’t even run.  And how do you think about Ford, who wasn’t technically eligible for “re-election”, never having been elected in the first place?

This leads us to the other way to think about this question, which is to put it in terms of elections. In other words, we can ask: For any given election year, was the guy in office chosen to serve again? There have been 58 Presidential elections in U.S. history, although we shouldn’t look at all of them. Obviously there was no one to re-elect in 1789, and in five cases the sitting President was legally barred from running again. In another eight cases, the President could have run again, but instead participated in the tradition of leaving after two terms.1 Though this wasn’t a hard and fast rule, it was a strong pressure against re-election, so let’s leave those elections out as well.

That leaves us with 44 elections in which the sitting President could realistically be re-elected. In those, re-election happened 22 times, exactly half—12 times the President didn’t run again, and in another 10 cases the President ran but lost. If we need a tiebreaker, we could count 1892 as a case when the President both was and wasn’t re-elected, since Ben Harrison lost to former President Grover Cleveland; that decides things for re-election by one (I was counting this as non-re-election, since the guy in office didn’t stay in office). But in any case, it’s tough to say the President is “usually” re-elected.

Of course, the people talking about the 2020 election probably don’t really care what happened with Cleveland and Harrison. I suspect they’re probably thinking, well, the last three guys got re-elected, and that gets you back about 25 years, so there you go. It’s fair to look at more recent elections, but this leads you to two problems. First, it’s tough to get enough data to draw any serious conclusions. The past 25 years only had three elections in which a President was eligible for re-election; not exactly enumerative induction.

Second, there’s no good way to know how far back to go. Starting at Clinton the data looks inarguable; go back one more guy and suddenly there’s a counterexample. Or say we start from the first year America had anything remotely resembling universal suffrage, with the passage of the 1965 Voting Rights Act. From there, five guys were re-elected and four weren’t (or, in the other terms, in nine eligible elections, there was a re-election five times). That’s hardly grounds for giving up hope in 2020. There’s no particular reason to pick any one cut-off date over another, so you can basically make whatever argument you want.

The long and short of it is that probably doesn’t make sense to talk about whether the President “usually” gets re-elected; it’s just sloppy thinking that gestures at history and empirical data without really engaging it. You’re better off looking at the factors that we know have a strong impact on election results—approval ratings, the state of the economy, gerrymandering effects, and so on.

Still, I think there are two pretty fair takeaways from all of this. First, if a President gets to the general election, he’s got a pretty solid chance of winning—that’s what happened in 22 out of 32 cases. But, second, it’s also pretty common for the President to fail, either through those 10/32 times the election goes against him, or because of the many factors that might keep him from running again. If he’s deeply unpopular, or he turns out to be in very poor health, or, just spitballing, the House discloses overwhelming evidence of Constitutional violations, criminal activity, and treason, it’s well within historical norms for the President to vacate the White House. The incumbency advantage is real, and we’ve learned that we should take the possibility of a Trump victory seriously. But we also shouldn’t resign ourselves to his winning. It wouldn’t be that unusual if he failed.


Notes
1. As FDR later showed, the traditional two-term limit was always a little more tenuous than it seemed; Washington obviously didn’t have to do it, Grant almost ran a third time, and Teddy Roosevelt eventually did run for a third term. I thought it was intuitive to count 1940 and 1944 as re-elections, even though I didn’t count, say, 1876 as a failed re-election for Grant (I just considered it an ineligible, traditional-two-term-limit year). I did count 1952 against re-election, since Truman chose not to run even though he was eligible, had FDR’s precedent immediately behind him, and hadn’t quite served two full terms. To me that seemed like Truman declining to run, although I think you could make a good case that this should also be considered an ineligible two-term-limit situation.

The MVP of Meeting MVPs, Part III

With the NBA season officially underway, it’s time for the third update to the network of MVPs. Here’s the image for this year:

2018_NBA_MVP

Here’s how it works (maybe skip this paragraph if you’ve read the posts in previous years). As always, the dots are players who won NBA MVP awards. They’re connected if they ever played on the same team, regardless of their MVP status at the time—so Harden and Durant are connected because they were on the Oklahoma City Thunder together, even though neither had been an MVP yet at that time. This time, the dots are colored roughly based on the players’ main team. The lines connecting them are automatically colored based on the dots they connect, and they’re sized based on betweenness centrality, which is a network statistic that basically shows how well a guy connects other clusters of guys—as my original post pointed out, Bob McAdoo is the king of this stat, having bounced around a lot in his weird career.

When I started making these, there were two major clusters, and 9 of the 31 MVPs were isolated, apparently doomed to enter history as MVP solo artists. Since then, Curry and Durant played some games together, Derrick Rose joined and left LeBron, and the MVP was awarded exclusively to former Durant teammates. To the horror of Thunder fans everywhere (presumably a very circumscribed version of “everywhere”), there’s a new cluster forming, and we’re down to 6/33 MVP isolates.

Back in 2016 I noted that our only real hope for further connections to the large cluster at the bottom of the network is Kawhi Leonard, and he’s really taken us on a roller coaster since then. First he came in third in one of the best MVP races in NBA history; he was good enough that he could very plausibly have won. Then he sat out for an entire season, seemed on the verge of forming a super-team in LA with LeBron, and wound up in Toronto. So who knows what’s up with that guy; there’s a possible world where he returns at full capacity and easily wins the MVP as the Raptors rule the East, then immediately leaves, joins LeBron, and fulfills his destiny as the Uniter of the Clusters. And there are many possible worlds where none of that happens.

In the meantime, there’s still plenty of hope for connecting the new cluster to the top. One interesting character here could be Karl Anthony-Towns, who has already played with both Garnett and Rose. And there are always the super-team-in-LA possibilities; both Westbrook and Durant have been at the center of Lakers rumors in the past, and it seems like LeBron intends to stay there awhile.

One cool thing about Harden winning: Last time I mentioned that 2010 holds the record for the season with the most past and future MVPs in the league. Several seasons have had 11 MVPs out there somewhere; in 2010 there were 12. But 2010 was also Harden’s rookie season, so now that number is up to 13. Somehow it remains true that every MVP-winner of this century was in the league that year.

Finally, each year I like to add something to these posts, and this year I thought I’d show the WNBA version:

2018_WNBA.png

All the same rules apply for reading the image. The obvious thing is that there are fewer nodes to work with here. Ordinarily in a network that makes it much more difficult to get the kind of dense interconnections you see in the Bob McAdoo and Dr. J area of the NBA chart. That’s just because there are fewer opportunities for things to connect. In this case, the issue is that the WNBA is a young league: It’s only been around since 1997. As a comparison, Dirk Nowitzki started playing in the NBA in 1999, and he’s still going. In the WNBA, there haven’t been as many chances for that kind of insanely long career.

As a result, there’s only one cluster with more than three players, and that’s only because Sheryl Swoopes and Yolanda Griffith joined the Seattle Storm for one season near the ends of their careers, just before Griffith hopped over to Indiana for three games the next season. Everyone in that cluster has retired, so it probably won’t ever grow, but the others are definitely live. In the rest of the graph, only Leslie is retired; only Fowles (note: this is the most confusing name I’ve ever heard in a basketball broadcast), Parker and Taurasi are over 30; and most of the players are in their primes. This year’s winner, Breanna Stewart, is only 24, so she might even keep getting better for another half decade. Almost the whole graph is like the Curry/Thunder cluster in the NBA graph—peak players who might easily wind up playing with the 2028 MVP winner on some future super-team in LA.

Race and Gender in the Senate

If America is ever going to be just, white people and men are going to have to lose some things. For people who care about social justice, it’s often more rhetorically effective (and, depending on who you are, comfortable) to frame things in terms of gains for women and people of color. Often, these genuinely are rising-tide situations; in theory, at least, the appalling racial wealth gap could be closed through African-American prosperity, without any white people losing their houses. Everyone wins!

But some things are zero sum. The U.S. Senate is a particularly clear example: The only way to get more seats for women and people of color is to take them away from men and white people. If you care about basic justice, or have even a remote commitment to the principle of fair representation, your only option is to disempower white men. And this is true to an even greater extent than you might think—I’ve got some data about the Senate below, but you might find it interesting to try and guess before you look at it: How many white men would need to lose their seats for the Senate to reflect the racial and gender makeup of America?

First, here’s the gender balance of the senate (see the Appendix at the end of the post for information about my sources, the categories I’m using, and so on).

Gender in the Senate

The bar on the left shows the real, present-day Senate; the bar on the right shows what the Senate would look like if it was truly representative of the United States population. We are 28 women Senators shy of a just Senate—more than we currently have. In fact, in the entire history of the Senate, there have been only 52 women Senators, meaning it would take almost every woman Senator ever just to reach the number we should have right now.

The numbers are even more striking when it comes to race/ethnicity:


RaceEthnicity in the Senate

With 91 Senators who are non-Hispanic white, this cohort is overrepresented by 29 seats. More important, they leave almost nothing for anyone else. We should have 13 African-American Senators; instead, in the entire history of the Senate there have been 10. Moreover, the current senate doesn’t have 13 seats for all people of color combined—and the situation is actually more dire than it appears here: Kamala Harris appears on this graph twice, since she was the only person listed twice in my source material, in her case as both Asian American and African American. (See the Appendix for more on multiracial identity in this data; here, my goal was to maximize the diversity I could show in the Senate—and this is still the result).

This decision to count Harris twice points to an interesting question about representation. In theory, there are more “efficient” ways to diversify the Senate than simply assigning seats by one race and gender at a time, as I’ve done here. If, for instance, ten seats held by white men went to ten new candidates like Harris, we’d have ten more women, ten more African Americans, and ten more Asian Americans all at once. These candidates really would reflect those identities, and the representativeness of the Senate would be improved for it. The problem is, we would still have too many white men. Overrepresentation is just as inaccurate a picture of the country as underrepresentation, even if we can correct them at different rates.

The actual Senate makes this clear. Here is the data where every Senator is categorized as either a Non-Hispanic White Man or not:


White Men in the Senate

The 72 white men in the Senate are wildly out of proportion to the country. Only 62% of Americans are non-Hispanic white people in total, much less white men. That means we have 41 too many white men in the Senate. This is really a staggering number: There are more extra white men than there should be white men total—so, while African-Americans only have 23% of the seats they should, white men have 232% of the seats they should. In short, two out of every five people in the Senate are extraneous white men. And that means that a group that shouldn’t even come close to a majority has a supermajority with votes to spare. From the standpoint of diversity, adding 10 mixed-race women would be good in itself; but we would still be left with a grotesque imbalance of white male influence on legislation.

Incidentally, this problem persists for Democrats, Independents, and Republicans:

White Men - by Party

In both absolute and percentage terms, it’s much worse for Republicans. There are 42 white male Republican Senators, meaning that one party has 11 more than the whole Senate should have. This is another way to see the scale of the imbalance; remember that there are 41 extra white men, so from a race/gender perspective, replacing the entire Republican party with women, people of color, and one white guy would get us to… fair representation. Still, Democrats and Independents are also quite unbalanced; to fix the problem, the entire political system would have to change.

Of course, it’s not clear that this is possible. Senators are elected on a state level, and there are, for instance, no states with a majority black population. If white people, and especially white men, are reluctant to vote for women and people of color, the Senate is likely to stay profoundly unrepresentative of American diversity—almost as though it’s an inherently unjust institution.

But there’s something telling about laying the injustice bare. This is how far we are from equality. If everyone had a fair shot at life and voters were unbiased, the Senate would look much more like the country it’s supposed to serve. Instead, 41% of its members are living proof that the past is not even past. If women and people of color are to have what is rightfully theirs—if, in other words, the American promise of representative democracy is ever to be achieved—the only solution in the Senate is to take from white men.


Appendix: Notes on the data

I’m taking racial and ethnic information about the U.S. from this Wikipedia page, which aggregates census data. Racial and ethnic categories are constantly in flux (as the history of the census shows), and the data reflect that ambiguity. For the graphs, I’m using the categories African American and Asian American, which the census considers racial, the category Hispanic/Latino, which the census considers ethnic, and the categories Non-Hispanic White American and All Other, which are somewhere in between. “All Other” includes the categories Native American and Pacific Islander, among other things. Overall, these are imperfect divisions with a lot of overlap, but I think they give a rough idea of American race and ethnicity in the kind broad strokes used in this piece.

For the racial/ethnic breakdown of the Senate, I’m using this government site. (I asked the Senate Historian’s Office how they reach the conclusions represented on that site, and a respondent said that most of the information there is based on historical sources, some on public statements, and for contemporary Senators on self -report—it seems that a Senator who disagreed with her own information could have it changed.)

Using this site, I assume everyone not listed there is non-Hispanic white. Kamala Harris is listed as both African American and Asian American; she is the only person who is listed as multiracial. In part, this may be because I used specifically Non-Hispanic White American—e.g., perhaps Ted Cruz and Marco Rubio would claim both identities. My decision here reflects an attempt to maximize the picture of Senate diversity, so my rule of thumb is to assign each person any identity that would affiliate them with people structurally disadvantaged by American racial and gender politics.

For gender, I used this page and assumed that any Senators not on it were men. This is a good example of how very limited this post is, in that it confines gender to two cis possibilities.  In this post, I’m not addressing representation of trans people—or queer people, people with disabilities, different national or language backgrounds, religious affiliation, or anything else, though these are all important areas where the Senate is similarly unrepresentative of the country.

Guns don’t protect against state violence, because they are state violence

Those of us who support gun control often like to mock the common pro-gun argument that personal ownership of firearms is a bulwark against potential tyranny from the state. It seems pretty mockable: On the one hand, you probably shouldn’t be planning a violent insurrection against your own democracy at all times, and on the other, it probably wouldn’t work—as Jim Jeffries puts it in his famous bit about guns, “You do know the government has drones, right?” But although I like that Jeffries bit, I think he’s a little off base here. I think guns really could be useful in battling tyranny if things took a very bad turn. This particular pro-gun argument is wrong for a subtler reason: Pro-gun people don’t want to battle an authoritative government. They love authoritative government, and guns are a big part of how their particular version of authoritarianism works.

First, the concession: Guns really can help in launching opposition to the state. When John Brown tried to overthrow the slave power, his first move was to raid an arsenal to try to get weapons for slaves; when Castro wanted to overthrow the Cuban government, he began stockpiling weapons; when the Black Panthers began their activism against the Oakland police, they made a point of carrying visible weapons. Historically, having or getting guns has been a very plausible way to prompt serious changes in your government.

But ask yourself this: Which of the rebels I just mentioned would the average American pro-gun activist like? I think it’s pretty obvious that the answer is “None of them.” Picture the kind of person who most vocally opposes gun control. Does that guy like the idea of armed black people? Does he like communists? Is he more of a John Brown guy, or more of a “build more Confederate statues” guy? And even more to the point: Does he think we should spend more or less money on the military? When he hears about Philando Castile or Tamir Rice, does he support the victims or the cops? Does he tend to like protesters? How does he feel about, say, Guantanamo, water-boarding, the border patrol, or prison camps for children?

That’s what I’m suggesting here: The average pro-gun person doesn’t want to guard against state authority. He loves state authority; state-sanctioned violence is one of his most consistent values. After all, who is a gun owner? According to Pew, gun owners are much more often male (39% own guns) than female (22%); much more often white (36%) than black (24%) or Hispanic (15%); far more often Republican (44%) than Democratic (16%); and within the Republican party, more likely conservative (95%) than moderate (69%).

So we’ve got men, who are much more likely to commit violent crimes (they represent about 80% of arrests for violent offense). We’ve got white people; a recent Washington Post article shows that the three “social attitudes” that best predict whiteness are “Approve of the police striking citizens”, “Own gun in home”, and “Favor death penalty for murder” (also in the top ten: “Own rifle in home” and “Own shotgun in home”). And finally, we’ve got the most committed Republicans, a group that overwhelmingly approves of our current President, who thinks police should rough up victims, pardoned (for no apparent reason) a criminal former-sheriff who described his own prisons as “concentration camps”, and, of course, runs his own prison camps for innocent children, to name just a few relevant policies.

All of which amounts to a picture of people who have little interest in limiting the government’s power to use violence against the people. What’s more, their fervent support for the government at this specific moment, in comparison with some of the paranoid fantasies that characterized the prominent right-wing response to the Obama era, suggests that their interest in revolution goes down as the state’s violent autocracy goes up. As long as the people at the top are also white male Republicans who love police violence and the death penalty, they’re happy.

This casts their love of guns in a different light. If the people who most adamantly oppose gun control are the same people who, in so many other contexts, seem to like state-sanctioned violence, then maybe guns aren’t a bulwark against state-sanctioned violence at all. Maybe they are state-sanctioned violence.

Of course, that’s true in a literal sense. The United States sanctions gun ownership, which is, as any remotely honest person can plainly see, the cause of our staggering gun violence. And who suffers? Well, black people are more likely than white people to know someone who has been shot (and more likely to be murdered by guns). Guns in the home put women at much greater risk of being killed by their partners. Poor people are significantly more likely to be the victims of violent crime than rich people. It’s the people who are already vulnerable; the people who have historically been on the receiving end of the most American violence; the people who, not coincidentally, tend to support gun control; the people who, also not coincidentally, tend to oppose Republicans, Trump, police brutality, ICE, and the whole rest of that litany.

But advocating for more guns in America isn’t just about direct violence against minorities, women, and the poor. It also creates the conditions for more complex state institutions of violence. In the United Kingdom, most police officers don’t carry guns. That country is hardly a cesspool of crime—their murder rate is 1.2 per 100,000 people; ours is 5.35—but it’s virtually unthinkable that we would ever follow their lead and disarm our police. We can’t, because the criminals here have so many guns. An officer in America heads into every call or confrontation aware that virtually anyone here might have a gun. And given the way implicit bias works in America, the police are even more likely to think they see a gun if a black person is involved, even if the particular officer is well-intentioned.

In short, widespread gun ownership creates the situation where we have armed police, police who are therefore much more likely to kill us, and, by extension, police who are much, much more likely to kill us if we’re black. This is the principle at work: The government sanctioning gun ownership makes it more likely that the government will kill us.

And to be more specific, it makes it more likely that the government will kill women, minorities, and the poor—the people, that is, who oppose all of these forms of state-sanctioned violence. Citizen gun ownership is a crucial part of this ecosystem, the way a certain form of authoritarian politics perpetuates itself. On the one hand it creates a situation in which it seems to make sense to keep a gun at home, even though that makes you more likely to die; or to arm the police, even though that makes it more likely that they will kill you. And, on the other hand, it disproportionately allocates the bloody consequences to those who most disagree with the policies—more succinctly, it kills the people who stand in the way.

None of which is to say that the victims couldn’t use guns in response. It worked, more or less, for L’Ouverture, the sans-culottes, Zapata, Lenin, Mao, Castro, Ho Chi Minh, and the guys who wrote the second amendment, to name a few. It’s not a strategy I would endorse in America—I’m avowedly on the side that says violence is both bad and, usually, impractical—but it has certainly led to its share of overthrown regimes. The pro-gun people aren’t wrong because they say firearms can start a revolution against a tyrant. They’re wrong because they don’t want a revolution. They are the tyrant. And the one right they hold dear is, they’ll tell you, locked away safely, where you and I and their children can’t get it. They often get that part wrong.

When was music?

If I made my own list of the 50 best albums of all time, I don’t think I’d include Sgt. Pepper. Granting that it’s a Very Important Album, I just don’t like it that much, and every time I go back to it, it seems to get a little worse: It has at least three novelty songs, one of the all-time worst Beatles tracks (the shrieking “GOOD MORNING GOOD MORNING”), and more mediocrities than you’d expect—”A Day in the Life” is awesome, but it only takes up so much of the album. Yet even writing this feels like some sort of moronic hot take, because of the critical weight that Sgt. Pepper carries; its reputation, like practically everything else from the late 60’s, is unassailable.

As a guy who likes pop music and making ranked lists of things, I’ve gotten tired of seeing the same boomer icons in the upper echelons every time. I would much rather listen to My Beautiful Dark Twisted Fantasy or Strange Mercy than to anything by the Rolling Stones, and I suspect lots of people younger than about 45 would agree with that. And yes, we could make our own list, but cultural consecration matters. I think MBDTF should crack the list, the broad American sense of what matters from our music history. But to make any headway, first we have to know what we’re up against. To what extent do the 60’s and 70’s dominate these lists?

To that end, I decided to look into the Rolling Stone list of the 500 best albums. First created in 2003 by “a panel of 271 artists, producers, industry executives and journalists“, and then updated in 2012 to include more recent stuff, it’s supposed to be the “definitive list of the 500 greatest albums of all time”. Of course, it’s not. But it has a few advantages over other lists: It reflects a genuine consensus of the kind of people who care about Rolling Stone-type taste, it’s really long (so many things can get on the list somewhere), and it has a fair claim to some kind of broad cultural importance—Wikipedia articles about these albums, for instance, usually mention their rank on this list. So what can we learn from it?

We can start with a nice little image of every album in it, arranged by year and what I’ll call “rank score”. This is just a way to assign points so that we can value each album more intuitively—the top album (Sgt. Pepper, of course) is worth 500, number two (Pet Sounds) is worth 499, and so on down to the last album (Aquemini; it would almost have been better not to include it at all than to suggest that there are nearly 500 better albums), which is worth 1. Here’s what that looks like:

All Albums

The albums stretch from Frank Sinatra’s 1955 In the Wee Small Hours to 2011’s The Smile Sessions, which is by… the Beach Boys. Yes, the most recent album on the entire list is 1960’s detritus that the band didn’t even bother to release at the time. But, as you can see, the list has at least something from most years. In fact, the only years that don’t feature any albums are 1958 and 2009.

A quick look at the top artists (everyone with 4 or more albums on the list) shows a pretty strong tilt toward the 60’s/70’s period, but there’s maybe a little more temporal (and not any other kind of) diversity than I’d expected:

Top Artists

The Dylan/Beatles/Rolling Stones trifecta (each with 10 albums on the list) is just what you’d expect, and once again we see a ludicrous celebration of meaningless late work. Dylan’s Modern Times comes in at 204 and is by far the highest ranking album of 2006, beating Amy Winehouse’s Back to Black by 247 spots. (It’s also beating The Times They Are a-Changin’, which isn’t on the list at all. I would be fascinated to meet an actual human who loves Modern Times but not Dylan’s “early, folky, political stuff”.) But still, at least there’s some concession to the existence of music after 1980, with Talking Heads, U2, the Police, the Smiths and Radiohead all joining the elites.

When you start playing around with the numbers, though, the time bias really begins to show. This graph shows how many albums from each year made the list:

AlbumsYear

If this is a skyline, it’s clear that the skyscrapers are almost all in the 1965-1980 period. The tallest is 1970, with 26 albums—one out of every 20 albums on the list is from that year. And this only looks worse if we change the y-axis to show us the rank score, instead of just the raw number of albums released:

Rank ScoreYear

Scroll back and forth between those images a few times, and you’ll see the left side of the graph steal a lot of blue from the right. So it’s not just that Rolling Stone is choosing more albums from the boomer period; they’re also ranking them higher.

I went looking for the most decorated 10-year period (really 11 years, to make it sound better), and just as you’d guess, it’s 1965-1975. This period makes up about 20% of the total timespan the list covers. Yet it contains 43% of the albums on the list, and 50% of all possible rank points. According to Rolling Stone, half of the best stuff in pop music history came out in just eleven years. And if we expand the cutoff to 1980 (as you can see above, there’s a real change in the skyline there), then we’ve got 55% of the albums and 62% of the rank points. For Rolling Stone and whatever experts were on its panel, pop music history basically happened from 1965-1980.

Now, looking at the charts above, you might think, well, 1991 looks pretty decent. That’s when Nevermind came out, and Rolling Stone ranks that album a respectable 17th, so I thought maybe there was a wave of grunge (possibly even some hiphop) on the list that year. Not really! Here are the best albums of 1991, according to them:

Rank Album Artist
17 Nevermind Nirvana
54 The Birth of Soul Ray Charles
63 Achtung Baby U2
65 Back to Mono (1958–1969) Phil Spector
75 Star Time James Brown
153 The Low End Theory
A Tribe Called Quest
209 Ten Pearl Jam
214 Proud Mary: The Best of Ike and Tina Turner Ike & Tina Turner
221 Loveless
My Bloody Valentine
255 Metallica (“The Black Album”) Metallica
310 Blood Sugar Sex Magik
Red Hot Chili Peppers
377 The Ultimate Collection: 1948–1990 John Lee Hooker
397 Blue Lines Massive Attack

What a picture of 1991! Who can forget walking out of Terminator 2, quoting a Simpsons joke, adjusting your Air Jordans, hopping into the car, and cranking up an album literally called Back to Mono and featuring the year 1958 in its title? Of the 13 albums on this list, 5 are compilations or reissues by artists who peaked decades earlier. If you remove that sort of thing, the skyline shifts even more to the left:

Rank ScoreYear, no compilations

It’s not as big a shift as it might be, though, because Rolling Stone starts including compilations from a pretty early date—their 11th best album, for instance, is The Sun Sessions, an Elvis compilation from 1976. They clearly did this so they could include even older artists in the list, people whose best work predates the era when musicians thought in terms of coherent album-length works. So in the top 30 we also have something called The Great Twenty-Eight by Chuck Berry and The Complete Recordings by Robert Johnson. These aren’t really albums in any traditional sense; they’re more like “things that were available on a disc of some kind.” Certainly they weren’t painstakingly crafted statements by the artists: Johnson was dead decades before anyone assembled whatever that thing is. Just think of how we listen to those guys today. I’ll still listen to Abbey Road all the way through, but when Chuck Berry died I just shuffled a bunch of his songs on Spotify—basically The Great Almost All of It.

Reaching back to people like Robert Johnson shows another weird feature of this list: Its insane hubris. Johnson is one of my favorite musicians, but it’s pretty strange to see him here. He sang virtuosic, cryptic blues songs in the 1930’s accompanied only by his acoustic guitar; how on earth do you stack that up against Pet Sounds? It’s very obviously not the same kind of thing. Yet Rolling Stone notably does not claim to be covering the best rock albums or even the best pop albums. They claim to be covering albums, full stop, and they clearly think they mean every album of any kind.

This mainly has the effect of revealing how little the overall group behind this list understands anything outside of the 1965-1980 period. It’s most notorious with hiphop. The top-ranked hiphop album on the list is Public Enemy’s 1988 It Takes a Nation of Millions to Hold Us Back, a solid choice, except that it comes in at 48. “Everything ever done in hiphop is pretty good,” Rolling Stone says, “but it’s no The Band, the second-best album by The Band.” They fill out the rest of their top 100 with zero other hiphop albums; next-highest ranking is Kanye West’s 2005 Late Registration at 118th; Outkast only has two albums on the list, none in the top 350; there’s nothing by Tupac, Scarface, or the Roots; The Plastic Ono Band is ranked 23rd.

For all that, I think the hubris is even clearer when it comes to jazz. Here again, they really just shouldn’t have included any at all. Instead, Miles Davis’s 1959 Kind of Blue comes in at 12th (just behind the Elvis compilation and ahead of The Velvet Underground and Nico). From there, here is the history of jazz according to Rolling Stone, using a reasonably capacious definition of the genre:

Rank Album Artist Year
12 Kind of Blue Miles Davis 1959
47 A Love Supreme John Coltrane 1965
95 Bitches Brew Miles Davis 1970
101 In the Wee Small Hours Frank Sinatra 1955
103 Giant Steps John Coltrane 1959
248 The Shape of Jazz to Come Ornette Coleman 1959
308 Songs for Swingin’ Lovers! Frank Sinatra 1956
358 Sketches of Spain Miles Davis 1960
447 Getz/Gilberto Stan Getz / João Gilberto featuring Antônio Carlos Jobim 1964

From this we learn that jazz took place between 1955 and 1970, and consisted of 7 musicians (counting Getz, Gilberto, and Jobim separately) and nine albums. Why not include Louis Armstrong’s Hot Fives/Sevens box sets? Or The Black Saint and the Sinner Lady or Mingus Ah Um, which Charles Mingus even had the decency to release in this time period? Or anything by Duke Ellington, Charlie Parker, Thelonious Monk, or Billie Holiday, among, I am told, others? It can’t be because many of these artists did their best work before the album era; we’ve already seen that any collection of songs counts as an album. I guess it must be that the vast majority of jazz doesn’t measure up to 1969’s Boz Scaggs, by Boz Scaggs (coming in at 496, ahead of, again, Aquemini). (Also, I’ll admit I’m sort of amazed Herb Alpert didn’t somehow sneak in there).

The batshit confidence you need to put Kind of Blue in your top 20 and then basically forget the entire genre exists for the next 500 spots is related, I think to the conviction that the soundtrack of baby boomer adolescence represents the apex of pop music history. Which is important, because we also shouldn’t overlook the possibility that this is sort of true. I know my own list would still include a lot of Dylan and the Beatles. Chronological clusters in culture happen. Plato knew Socrates and Aristotle; Haydn taught Beethoven and Mozart; Shakespeare and Cervantes died (more or less) on the same day.

So maybe 1965-1980 was just the right time for pop music to happen; it wouldn’t be unthinkable, just as, if we ranked the best symphonies of all time, I doubt we’d have a ton from the 1990’s at the top of the list.  But I’m not entirely convinced by this argument. For one, Rolling Stone aimed so preposterously high; their list theoretically should include the best symphonies of all time, assuming they were ever recorded. (There are no good classical albums, according to Rolling Stone.) For another, this brief dip into non-boomer genres shows that the people behind this list have no idea what they’re talking about when it comes to the periods and genres outside their small window of cultural love. They’re not ignoring Tupac because 1969 is better than 1994; they’re ignoring him because they don’t know what to do with him, whereas some of them have fond memories of that one track on Boz Scaggs.

I get it. If I had to list 500 albums, I’d probably have at least three Weezer albums on there by the end. Is the Green Album a masterpiece? No, but I really liked listening to it in high school. I’d also have stuff like Let England Shake and How I Got Over and Bachelor No. 2 and Jacksonville City Nights and A Sailor’s Guide to Earth, none of which made a huge cultural impact but all of which are very well done and mattered to me. And more to the point, they’re just as good as virtually everything on this list. The 10th best Beatles album is not inevitably better than good stuff from 2008, even if it wasn’t released by Bob Dylan’s ghost.

With enough millennials on the panel, I think we’d see more albums like those—the “second best album from The Band” for people who tend not to revere baby boomers, to say the least. And we’re ready: We’ve been nostalgic since before we were finished doing the things we’re nostalgic about. Our culture’s best musical days may be behind us—but they’re catching up.

Future History Part II: Where Will Trump Rank?

Note: This is a post I wrote on January 9, 2017; at the time, I found it too depressing to publish. With Presidential rankings in the news, I thought it might be interesting to revisit.


Donald Trump is obviously going to be one of the worst Presidents in American history, but will he be the worst? In this post, I take a stab at predicting some possible outcomes of his Presidency. Of course, this should all be taken with a grain of salt; in an earlier post, I suggested that he might lose the election by about 200,000 votes, and instead he won it by about -3,000,000 votes. Moreover, it’s tough to determine a President’s legacy in the heat of the moment. I remember thinking back in 2005 that George W. Bush was easily one of our two worst Presidents; with the mellowing effects of time it now seems clear that he is merely one of the five worst. So guessing before Trump even takes office will be difficult. Yet, why not?

The Ceiling:

If we assume that Trump will do even a small fraction of the things he has said he will do (and political history suggests that he will try), or even that he will simply continue to behave as he has so far, then the best thing that could happen to his legacy would be for him never to take office. Perhaps he would decide Washington D.C. is too muggy and resign; perhaps his flagrant conflicts of interest would accidentally infringe on something Republican representatives care about; perhaps Putin would simply text him, “change of plans”.

In that case, the clear historical comparison would be William Henry Harrison, who died on his 32nd day in office. It’s a common misconception that this places him near the bottom of the Presidential rankings, but this is based on the naive assumption that when Presidents do things, those things are mostly good. In fact, many of the Presidents have tended to do mostly bad things. As a result, WHH is really a middle-of-the-pack guy, near the other forgettable do-nothings like Fillmore and Coolidge. Once you get toward the bottom ten or twelve Presidents you’re already looking at guys like Nixon and Hoover, and WHH clearly didn’t cause as much harm as them. So does this mean Trump has hope of being merely forgotten?

Well, not quite. He has already had a poisonous impact on American discourse and incidents of intolerant violence, his election has delivered a blow to American credibility that we (justly) may never recover from, and he has even managed to ramp up the risk of war with China. Harrison did pick horrible President John Tyler as his VP, so that’s a knock on him, but I think you have to put Trump below WHH even now. I’d say he’s down around Harding or McKinley, in the bottom 12 or 13. Verdict: Ceiling = 13th worst President.


The Floor:

Given his vindictiveness, pettiness, cruelty, and utter ignorance of the world, Trump might start a nuclear war. In that case he would be our worst President. Depending on the scope of the war, he would also have a shot at becoming the worst person in world history. Verdict: Floor = Worst Human Being of All Time


The Likely Scenario:

Of course, it’s impossible to predict exactly what Trump is going to do (I doubt he has a very clear idea himself), much less what will happen outside of his control in the next four to eight years. But a few things seem quite likely:

  • He will oversee a fairly extreme version of Republican dismantling of the welfare state. Since the GOP has the House and Senate, we should expect something like the Ryan Plan to pass, as well as some sort of repeal of Obamacare. How this affects his rank will depend on your political views, i.e. whether you think it’s bad that tens of millions of people will lose health insurance, children will go hungry, inequality will skyrocket, etc.
  • He will be the most corrupt President in modern history, if not ever. So far he has not even bothered to hide his conflicts of interest; he doesn’t even quite seem to grasp the concept of a conflict of interest. I think this is because he doesn’t understand the idea of interests beside his own, but general stupidity would explain it, too. In any case, this would not only be reprehensible on its own merits, but could lead to the kind of deeply distressing systemic corruption described by Matthew Yglesias. But even if it stops short of that—essentially a dystopian kleptocracy with massive inequality and zero first-amendment protections—it would still be on the order of the kind of corruption that always pushes people like Grant, Harding, and Nixon down in the rankings.
  • Many things will stop functioning. He’s staffing everything with ideologues and cronies. I expect something like Bush’s FEMA in virtually every department Trump pays any attention to.
  • He will enable and occasionally enforce massive civil rights / human rights abuses. His immigration policy is essentially ethnic cleansing; his attitude toward Muslims is lightly revised 1930’s anti-Semitism; the company he keeps and the rhetoric he inspires have already set racial politics back decades.
  • He will destabilize the international order. The degree essentially depends on the extent to which the international order is capable of withstanding a hateful idiot at the helm of the world’s most powerful country. Current international context does not bode well for the reign of a man who thinks NATO is a protection racket and views foreign policy as a vehicle for putting his name on hotels in every nation.

I feel confident he’ll do all that. But as the list goes on, it becomes less clear exactly how bad each thing would get, and of course we don’t know exactly what else he might do on top of it—it wouldn’t be surprising if he goes right back to the regulatory atmosphere that caused the Great Recession, for instance. Perhaps he’ll do a good thing, too, although it’s difficult to imagine what it would be.

In any case, this is already enough stuff to guarantee him a place in the bottom three. He skates past Buchanan (he lost several states to secession, but it’s not clear that many Presidents would have done too much better) and Bush (his disastrous wars were limited to two countries) and joins Andrew Jackson (genocide, economic collapse) and Andrew Johnson (setting back the cause of racial justice for 100 years) down at the bottom. Those are a tough two to beat; they caused a lot of damage. It’ll be tough to beat them—there’s no equivalent to an electoral college bailout when it comes to wreaking moral havoc. In essence, we have to hope that the Trump of lazy incompetence (his business life) overpowers the Trump of hateful cruelty (his political and personal life). That should be just enough to ensure that he is not quite the worst person ever to hold this job. Verdict: Likely Scenario = Hopefully third worst President

The MVP of Meeting MVPs, Part II

With the NBA season officially underway, it’s time to revisit last year’s post about the connections between MVPs. To get right to it, here is the updated version of the image at the center of everything:

Screen Shot 2017-10-17 at 2.16.21 AM

We see here every player who has won the NBA MVP award. They’re connected if they ever played on the same team, even if they were together before one or both of them had won—so Westbrook and Durant are connected, even though when they were both on the Thunder Westbrook hadn’t won yet. The thickness of the edges—the lines connecting the players—reflects how many years they played together; the color is more or less based on the team they shared.

Two major things have happened since last year’s post. First, Westbrook won the MVP. This means we’re developing a new little cluster over there on the left. The crazy thing is that this would still have been true if the voters had (correctly) given the trophy to the other major contender, James Harden (I’m from Houston), since he was also on the Thunder. He has a reasonable shot at winning it sometime in the next few years, so that little cluster might still grow.

The second major event is that Derrick Rose joined the Cavs, connecting him to LeBron James. I’m proud to report that, unlike virtually everything else I have predicted on this blog, I pretty much correctly called this one: Last year, talking about how the graph might grow more interconnected with time, I said:

Derrick Rose could be a key player here; often these guys start moving around when they’re a little worse, either because of age or, as with Rose, injury.

It was an obvious thing to guess, but so were a lot of things that didn’t pan out. Anyway, with these two events, our overall interconnectedness has grown quite a bit. Last year 22.5% of MVPs were solo artists; this year, we’re down to 18.8%.

What’s next? I still have hope that we can connect the two major clusters. Step one is for Kawhi Leonard to win the MVP; I don’t really want that, since I dislike the Spurs, but he is the favorite in Vegas at the moment. Step two is for someone from the other cluster to switch teams; again, Rose might play a big role here, a Bob McAdoo for our troubled times. And, down the road, who knows what will happen with Westbrook—it’s hard to imagine that guy ever taking fewer than 20 shots a game for an NBA season. Someday he might have to travel to make that work.

Bonus content: Now that I have a big list of the entire careers of MVPs, I can ask hard-hitting questions like, when did the NBA have the most (past or future) MVPs playing at the same time?

Of course, you could also ask when the NBA had the fewest MVPs, but the answer there is dumb: From 1951-1954, Bob Cousy was the only guy in the NBA who would ever win an MVP, in part because the award had not yet been invented. In the modern era—say, 1980, when they introduced threes— there are two answers, both kind of weird. In 1981, there were six (Kareem, McAdoo, Dr. J, Bird, Magic, and Moses), but only because Bill Walton was in the middle of an injury that lasted two entire years. And then in 1994, you also had six (Ancient Moses, Barkley, Karl Malone, Robinson, Olajuwon, and Baby Shaq), but only because Jordan was on his mysterious baseball walkabout.

Anyway, the answer for most at once is 2010, when there were 12 active MVPs. That year LeBron won it for the second time. Back then, every winner of the 00’s was still around, in various states of collapse (Shaq, Iverson, Duncan, Garnett, Nash, Nowitzki, Kobe). And every winner of the 10’s (so far) had just joined the league (Rose, Durant, Curry, Westbrook). LeBron was the pivot.

We’ve had 11 concurrent MVPs a bunch of times: Once in the 80’s, twice in the 90’s, and four times since then. But today, we’re sitting at just 9, with Nowitzki almost certain to retire before we can boost the numbers much. Still, everyone else is either young enough to play another 5-6 years or is LeBron James, so we’ve got a shot to get back up there—and who knows, maybe Rose will join them all.

The Worst First 100 Days

Trump’s first 100 days have been a unique cocktail of horror and failure, but where do they rank historically? Is he as superlative on this metric as he is on, say, health, or intellect? It’s a tough question to answer, because there are lots of different ways to judge the first 100 days.

One path is simply to assess the state of the union: How well is the country doing at the end of the first 100 days, compared to before? In these terms, the worst first 100 days surely belong to Lincoln. He had only been in office for about a month when the South attacked Fort Sumter, basically starting the Civil War. Some people would argue that Lincoln bears a lot of the blame for the Civil War, but they’re mostly buried in Confederate graves with the rest of the pro-slavery traitors who lost that war. So although you can’t easily top “descending into civil war” as a catastrophic start, it doesn’t really reflect on how well Lincoln was doing the job at hand.

Another way to look at it is personal success: How well did the President accomplish his goals? The clear worst all time on this metric is William Henry Harrison. During his first 100 days he died, one of the worst professional setbacks you can have. Not only that, his death saddled the nation with his idiot successor, John Tyler, the subject of our nation’s first impeachment hearings, a sitting President not re-nominated by his own party, and the only President whose death was not recognized by Washington, since he had joined the Confederacy.

The thought of Tyler raises another question: Which President caused the most destruction in his first 100 days? This is a tough one to answer, but here are three candidates:1  

  • Rutherford B. Hayes immediately ended Reconstruction as a condition for winning the Presidency at all. Clearly this was a good political move for him (he got to be President), but, as historian Eric Foner argues of Reconstruction in general, “What remains certain is that Reconstruction failed, and that for blacks its failure was a disaster whose magnitude cannot be obscured by the genuine accomplishments that did endure.” So Hayes had a big hand in that, which seems pretty bad.
  • Gerald Ford pardoned Richard Nixon during his first 100 days. The ethics of this are debatable I guess, but it was a major blow to him politically, and one reason he was never elected President.
  • My personal choice: During his first 100 days, Nixon started Operation Menu, a secretive bombing campaign in Cambodia. At the very least this killed thousands of people; at worst, it was an important step in Nixon’s general Cambodian policy, which contributed to the rise of people like Pol Pot.

So where does that leave Trump? In terms of sheer destruction, I don’t think he matches Hayes or Nixon. What makes him interesting, though, is his unique blend of horrific policies and political failures:

Horrors

Failures

Of course, these are not comprehensive lists, but this is still a pretty unusual mix of achieving bad goals while also failing in spectacular fashion. He has somehow managed to combine historically destructive outcomes with several high-profile failures to do anything at all. I guess we could consider this some sort of grotesque reversal of an inspirational poster I loosely remember from high school:

PosterCropped.png

Though not scientifically accurate, this inane claim makes an important point. Man’s reach should exceed his grasp; no one reaches more greedily than Trump, and no one has a tinier grasp. I’d say his first 100 days aren’t quite the personal failure of Harrison, or the policy horror of Nixon, but they’re historic nonetheless.


Notes

1. One fascinating case that just misses the cut: Harry Truman, who on his 116th day in office dropped a nuclear bomb on a city.

The Courage of Our Convictions (for Perjury)

It seems pretty likely that Attorney General Jeff Sessions recently committed a felony, which is a pretty compelling reason to remove him from his position at the head of our nation’s justice system. Specifically, it appears that he committed perjury by lying under oath. Under any reasonable interpretation, the case against him is pretty straightforward. During his confirmation hearings, he said, “I have been called a surrogate at a time or two in that [i.e., the Trump] campaign and I did not have communications with the Russians.” But he did have communications with the Russians, in that he met with the Russian ambassador at least twice during the Trump campaign. This sounds a lot like perjury.

In the real world, perjury cases are pretty difficult to prove, which is probably usually a good thing. This article gives a pretty good rundown of the difficulties of pinning a perjury charge on Sessions for this issue. The long and short of it is that language is full of ambiguity. Did Sessions mean that he didn’t meet with the Russians as a Trump surrogate? Did he just forget about the meeting, like an idiot?1  These distinctions matter, from a legal standpoint.

Still, there was one famous case not too long ago in which these ambiguities were widely ignored by our legislative branch. The impeachment of Bill Clinton in 1998 rested largely on a perjury charge, in circumstances that were also fairly ambiguous—this is where we got Clinton’s famous line that “It depends upon what the meaning of the word ‘is’ is”.2 But at the time, a lot of our legislators believed that ambiguities were not important, and that Clinton should be removed from office. Perhaps we should encourage our current Senators and Representatives to take a page from then-Alabama-Senator Jeff Sessions, and find now-Attorney-General Jeff Sessions guilty of perjury.

Fortunately, nine of the Senators who voted Clinton guilty of perjury are still in office. In the House, there are 26 remaining Representatives who cast the equivalent of “guilty” votes on a perjury charge.3   Their names appear below, along with contact information. We can safely assume that they all believe strongly in a very broad interpretation of this law, so it would be very unfortunate if they missed the chance to convict Sessions for meeting with Russian officials and then claiming under oath that he did not meet with Russian officials. To that end, if any of these people represents you (you can check your representative here), or if you have a phone, it only makes sense to contact them and urge them to hold fast to the principles they demonstrated in the Clinton era: find Jeff Sessions guilty of perjury, and do everything they can to remove him from office. To quote a longtime perjury-hawk, “the American people believe no one is above the law.”

Chamber Person Represents Phone Number for D.C. Office Other Contact Info
Senate John McCain Arizona (202) 224-2235 https://www.mccain.senate.gov/public/index.cfm/contact-form
Senate Mike Crapo Idaho (202) 224-6142 http://www.crapo.senate.gov/contact/email.cfm
Senate Chuck Grassley Iowa (202) 224-3744 http://www.grassley.senate.gov/contact
Senate Pat Roberts Kansas (202) 224-4774 https://www.roberts.senate.gov/public/?p=EmailPat
Senate Mitch McConnell Kentucky (202) 224-2541 http://www.mcconnell.senate.gov/public/index.cfm?p=contact
Senate Thad Cochran Mississippi (202) 224-5054 https://www.cochran.senate.gov/public/index.cfm/email-me
Senate Jim Inhofe Oklahoma (202) 224-4721 https://www.inhofe.senate.gov/contact
Senate Orrin Hatch Utah (202) 224-5251 http://www.hatch.senate.gov/public/index.cfm/contact?p=Email-Orrin
Senate Mike Enzi Wyoming (202) 224-3424 http://www.enzi.senate.gov/public/index.cfm/office-locations
House Don Young Alaska at-large 202-225-5765 http://donyoung.house.gov/
House Jim Sensenbrenner Wisconsin 5 202-225-5101 http://sensenbrenner.house.gov/contact/info.htm
House Hal Rogers Kentucky 5 202-225-4601 https://halrogers.house.gov/office-info
House Chris Smith New Jersey 4 202-225-3765 http://chrissmith.house.gov/contact/
House Joe Barton Texas 6 202-225-2002 https://joebarton.house.gov/
House Lamar S. Smith Texas 21 202-225-4236 http://lamarsmith.house.gov/
House Fred Upton Michigan 6 202-225-3761 http://upton.house.gov/contact/zipauth.htm
House John Duncan Tennessee 2 202-225-5301 http://duncan.house.gov/
House Dana Rohrabacher California 48 202-225-2415 https://rohrabacher.house.gov/contact/offices
House Ileana Ros-Lehtinen Florida 27 202-225-3931 https://ros-lehtinen.house.gov/contact-me
House Sam Johnson Texas 3 202-225-6673 http://samjohnson.house.gov/
House Ken Calvert California 42 202-225-1986 http://calvert.house.gov/contact/
House Bob Goodlatte Virginia 6 202-225-5431 https://goodlatte.house.gov/
House Ed Royce California 39 202-225-4111 http://royce.house.gov/contact/stopby.htm
House Frank Lucas Oklahoma 3 202-225-5565 https://lucas.house.gov/contact-me
House Rodney Frelinghuysen New Jersey 11 202-225-5034 https://frelinghuysen.house.gov/contact-us/
House Walter B. Jones Jr. North Carolina 3 202-225-3415 https://jones.house.gov/contact-me
House Frank LoBiondo New Jersey 2 202-225-6572 https://lobiondo.house.gov/contact-me
House Mac Thornberry Texas 13 202-225-3706 http://thornberry.house.gov/contact/
House Robert Aderholt Alabama 4 202-225-4876 https://aderholt.house.gov/
House Kevin Brady Texas 8 202-225-4901 http://kevinbrady.house.gov/contact/
House Kay Granger Texas 12 202-225-5071 http://kaygranger.house.gov/contact-kay
House Pete Sessions Texas 32 202-225-2231 https://sessions.house.gov/contact
House John Shimkus Illinois 15 202-225-5271 https://shimkus.house.gov/
House Steve Chabot Ohio 1 202-225-2216 http://chabot.house.gov/contact/
House Mark Sanford South Carolina 1 202-225-3176 https://sanfordforms.house.gov/contact/

(Note: If you don’t immediately see any useful contact information in the linked sites, try scrolling down to the bottom of the page. A lot of these guys hide their office locations and phone numbers down there.)

Notes


1. This line of defense hinges on the idea that Sessions completely forgot meeting the ambassador of Russia, the country that was then all over the news for its suspicious involvement with the Trump campaign that Sessions was heavily promoting. In other words, Sessions is arguing that he is too stupid to be the Attorney General, rather than too criminal. 

2. Clinton was right about this. He made a present tense statement, “There’s nothing going on between us”, which was true at the time he said it. Compare Sessions’s claim that he meant he never met with the Russians “as a Trump surrogate”, which is not what he said. 

3. I’m referring to everyone who voted “Yea” on Article I of H.Res.611, as recorded here. It appears to me that Article II also dealt with a perjury charge, but since it failed I ignored it.